Counting the World's Informal Workers: Key Facts
Global Numbers
The first global estimates based on official surveys on the size of informal employment, were published by the ILO in 2018. These show 61% of all workers were informally employed worldwide. As the ILO receives updated data and data from additional countries, new estimates are prepared. The 2023 update based on data collected mainly in the year 2019 shows that globally informal employment decreased to 58% of total employment. Informal employment continues to be the major source of employment worldwide, comprising nearly 2 billion workers.
of the world's workers are informally employed – representing 2 billion people
Source: ILO. 2023. “Women and men in the informal economy: A statistical update."
By Sex and Country Income Groups
The estimates on informal employment by country income groups (below) show a clear relationship between low levels of GDP and high levels of informal employment in countries.
Globally, informal employment is a greater source of employment for men (60% of male workers are in informal employment) than for women (55% of women workers are in informal employment) and in all but the lowest income grouping of countries. A major factor contributing to this is the low rate of informal employment of women in comparison to men in several countries with large populations, such as China and Russia. These countries have an important impact on the averages, both globally and for the country income groups. However, the Women and Men publication also reports that in 56% of countries--especially low and lower middle income countries-- the share of women’s total employment that is informal is higher than men’s.
Informal employment as a per cent of total employment by sex and country income groups
| Country Income Group | Total | Women | Men |
|---|---|---|---|
| World | 58.2% | 55.2% | 60.2% |
| Lower-income | 89.0% | 92.1% | 86.7% |
| Lower-middle income | 81.5% | 81.4% | 81.7% |
| Upper-middle income | 49.7% | 48.6% | 50.6% |
| Higher income | 15.9% | 15.3% | 16.3% |
Source: Source: ILO, Women and Men in the Informal Economy: A Statistical Update, 2023, figure 3, panel A
See Annex 1 of the source publication for the classification of countries/territories by income group (per capita gross national income)
Informal employment is the major source of employment for women and men in all of the country income groups – except the high income countries.
Rural and Urban Informal Employment
The overwhelming majority of rural employment is informal globally in all of the country income groups except higher income countries. In urban areas, less than half of employment globally is informal. However in low income and lower-middle income countries around three quarters of urban employment is informal.
Informal employment as a per cent of total urban and total rural employment by country income groups
| Country Income Group | Urban | Rural |
|---|---|---|
| World | 42.8% | 81.7% |
| Low income | 77.8% | 93.7% |
| Lower-middle income | 72.9% | 89.7% |
| Upper-middle income | 37.6% | 78.3% |
| Higher income | 13.6% | 17.6% |
Source: Source: ILO, Women and Men in the Informal Economy: A Statistical Update, 2023, figure 11, Panel A.
See Annex 1 of the source publication for the classification of countries/territories by income group (per capita gross national income)
Over three-quarters of employment is informal in rural areas globally –except in high income countries
Source: ILO, Women and Men in the Informal Economy: A Statistical Update, 2023
By Status in Employment
Globally, close to half (47%) of all workers in informal employment are own-account workers. They represent the largest share of workers in informal employment. This is followed by employees (who represent a 35% share), contributing family workers (16%) and employers (less than 3%).
Status in employment as a per cent of total informal employment by country income groups
| Countries by Income Level* | Employers | Employees | Own-Account Workers | Contributing Family Workers |
|---|---|---|---|---|
| World | 2.8% | 34.5% | 46.6% | 16% |
| Low income | 1.8% | 15.5% | 55.5% | 27.2% |
| Middle income | 2.8% | 35.7% | 46.5% | 15% |
| High income | 5.2% | 62.6% | 25.0% | 7.1% |
Please consult the source listed for the countries in each income group
By Geographic Region
The regional categories in the table below are based on geography and not on the country income levels. Thus within most of the geographic categories there is a mix of high and lower income level countries. For example, the Asia and the Pacific region includes not only low and middle income countries where informal employment is high but also high income countries such as Australia, Japan, Korea, and New Zealand where informal employment is low.
Percentage of informal employment by region and sex
| Total | Women | Men | |
|---|---|---|---|
| World | 58.2% | 55.2% | 60.2% |
| Africa | 84.3% | 88.2% | 81.4% |
| Americas | 36.5% | 34.5% | 38.0% |
| Arab States | 54.0% | 43.0% | 55.9% |
| Asia and the Pacific | 65.9% | 61.7% | 68.4% |
| Europe and Central Asia | 19.7% | 20.0% | 19.4% |
Source: ILO. 2023. “Women and men in the informal economy: A statistical update, figure 29, Panel A.
In Africa, The Arab States and Asia and the Pacific, the majority of employment is informal.
By Country & City
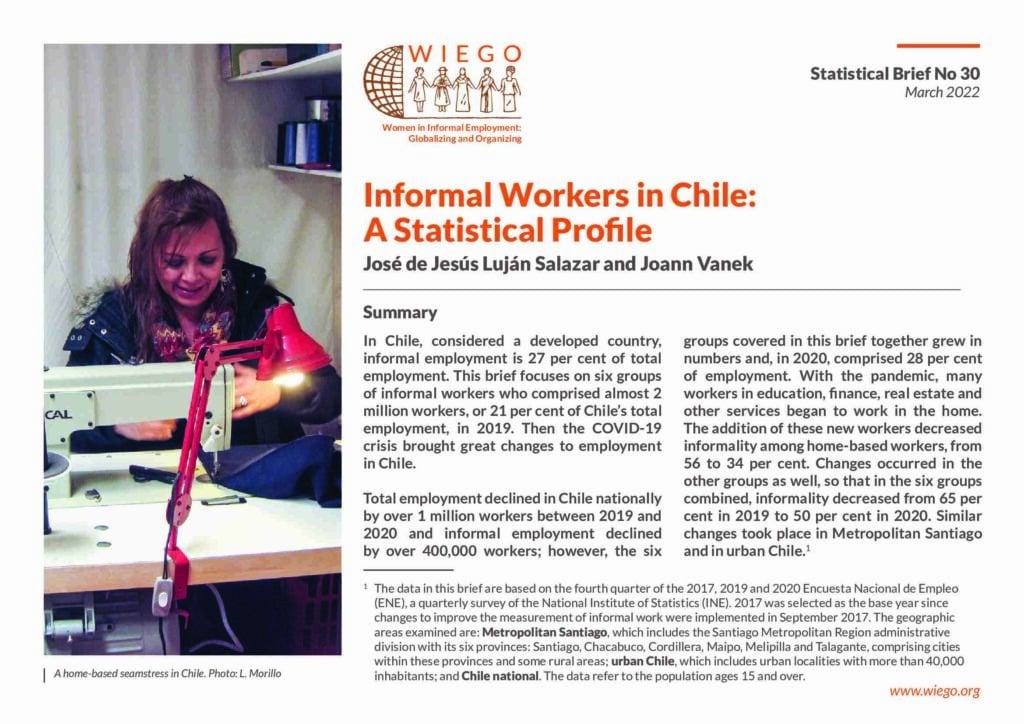
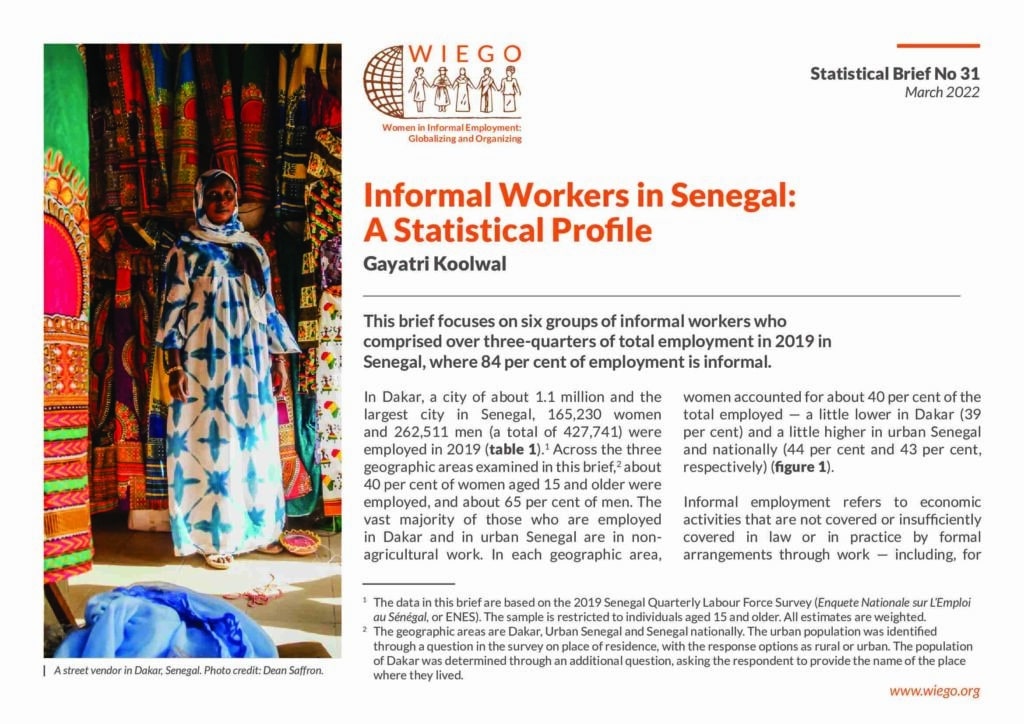
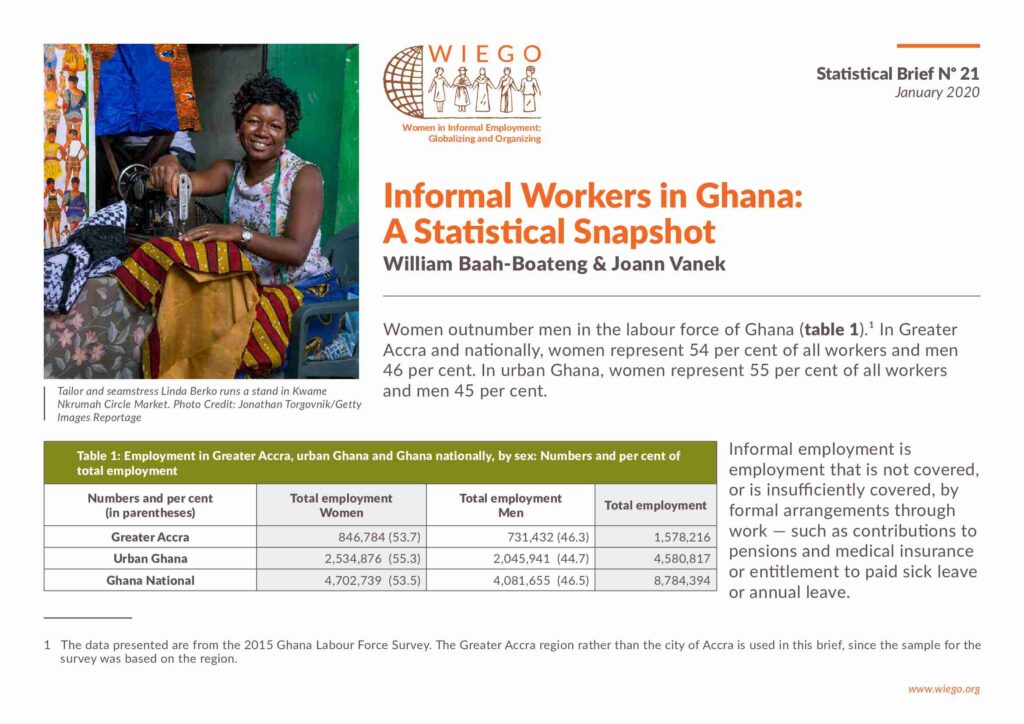
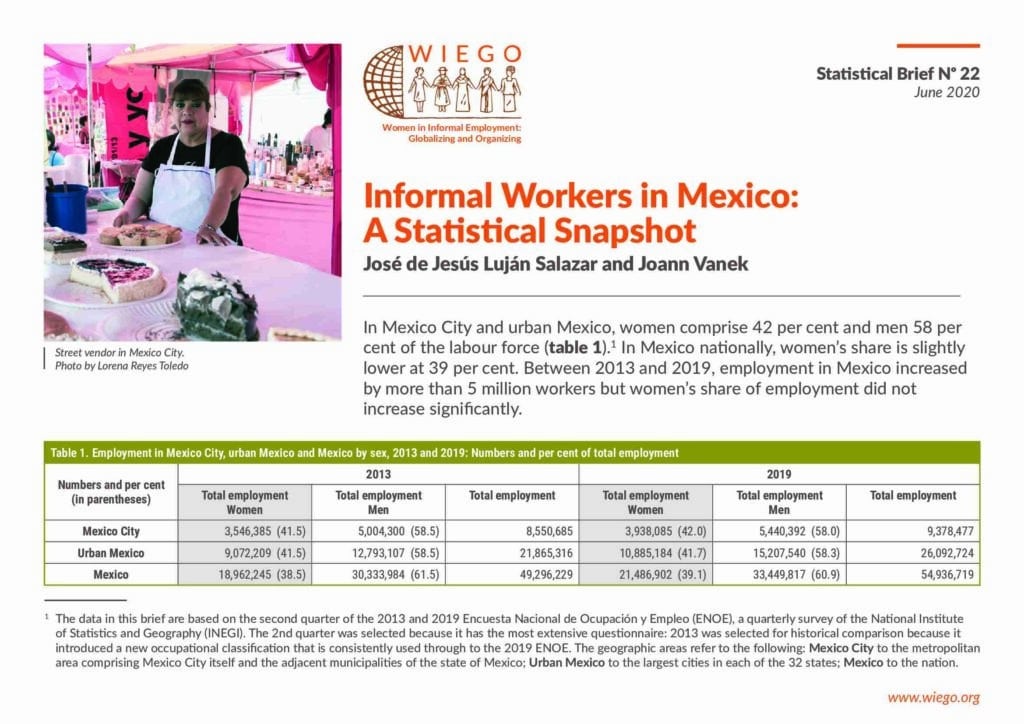
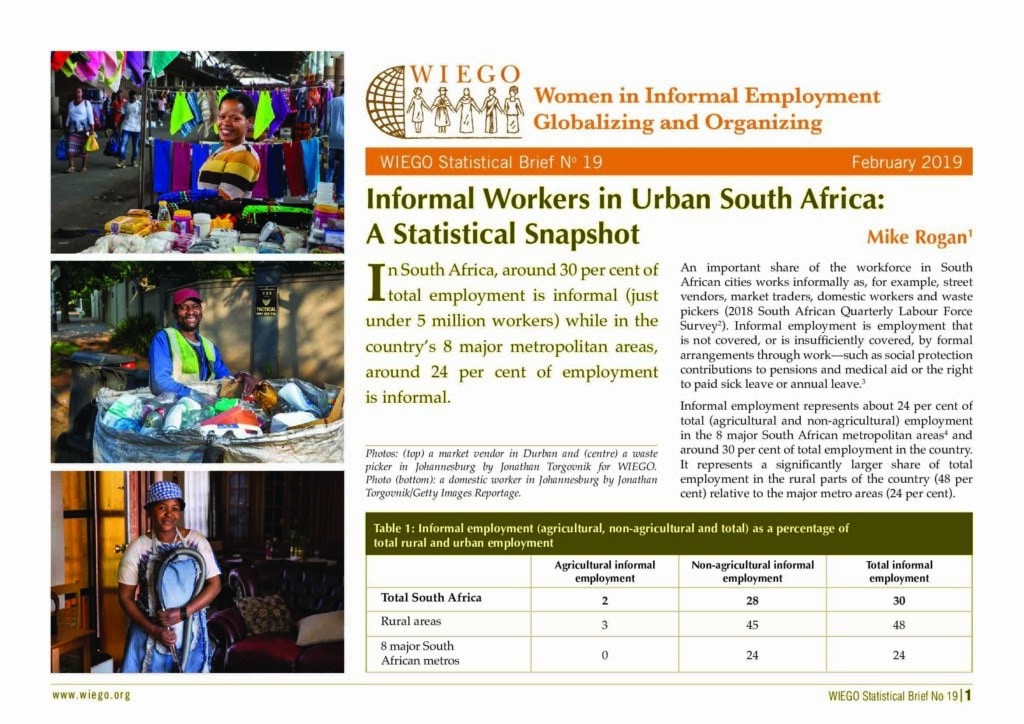
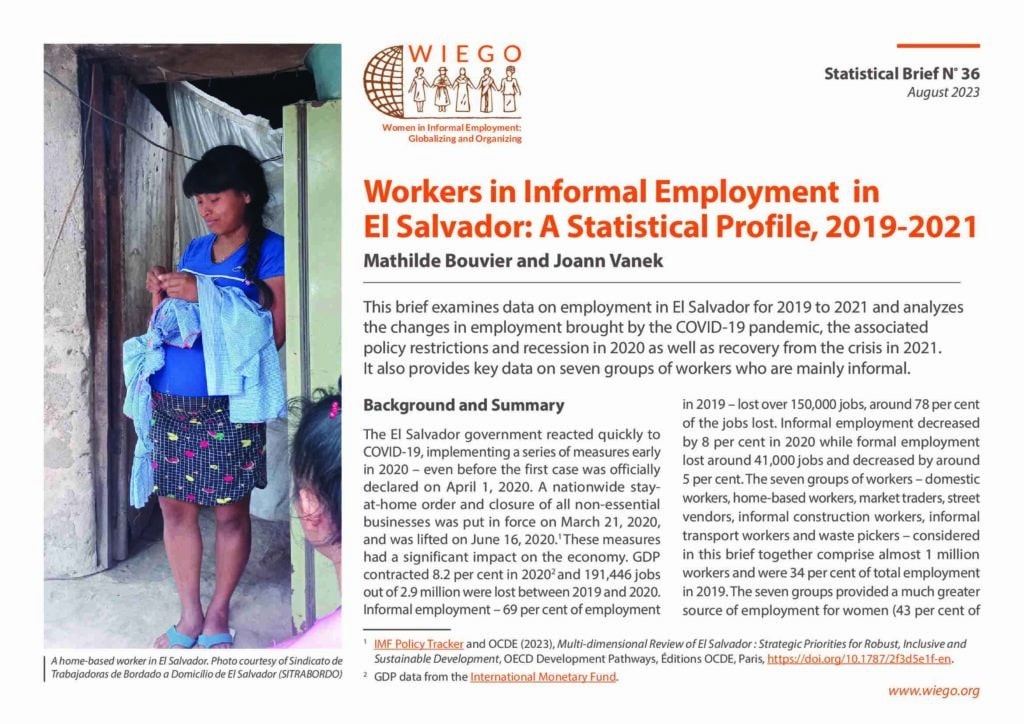
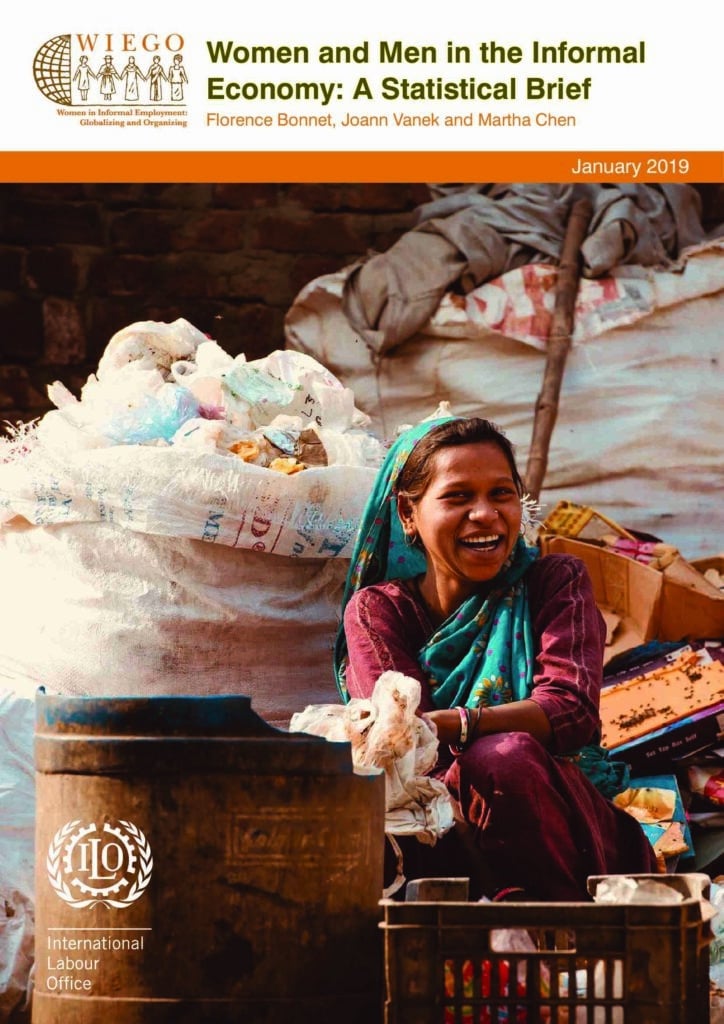
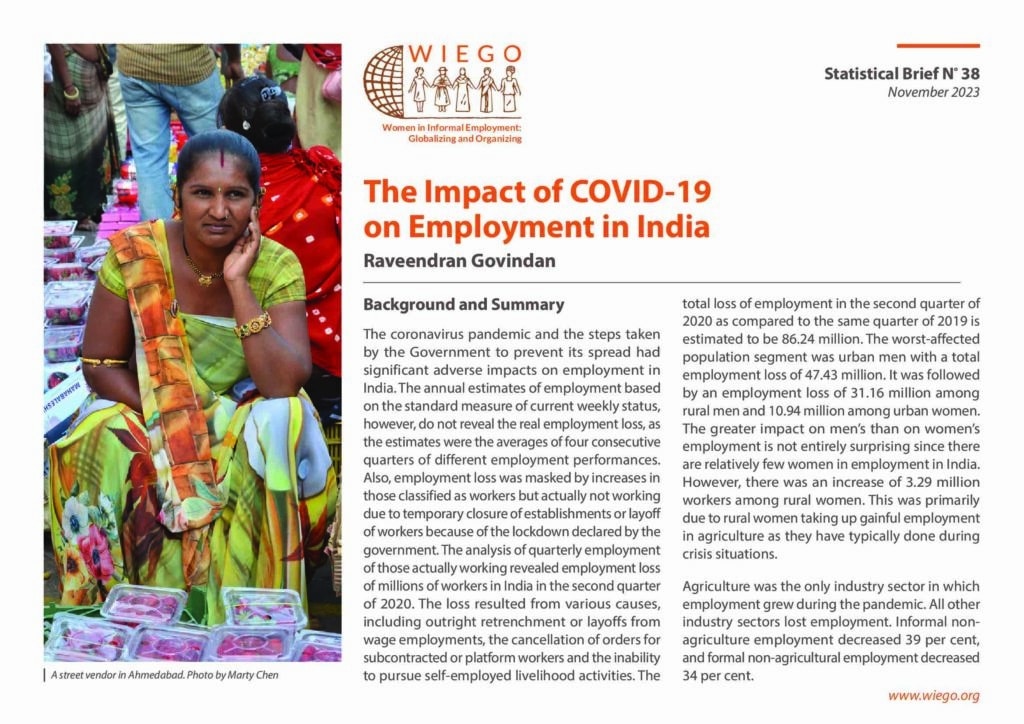
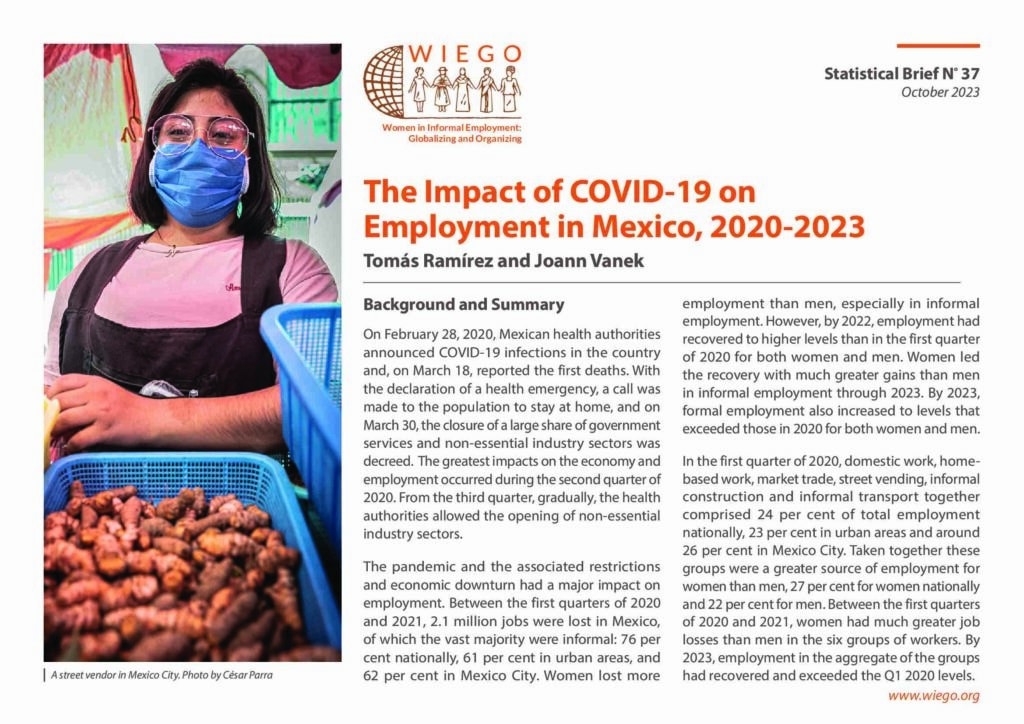
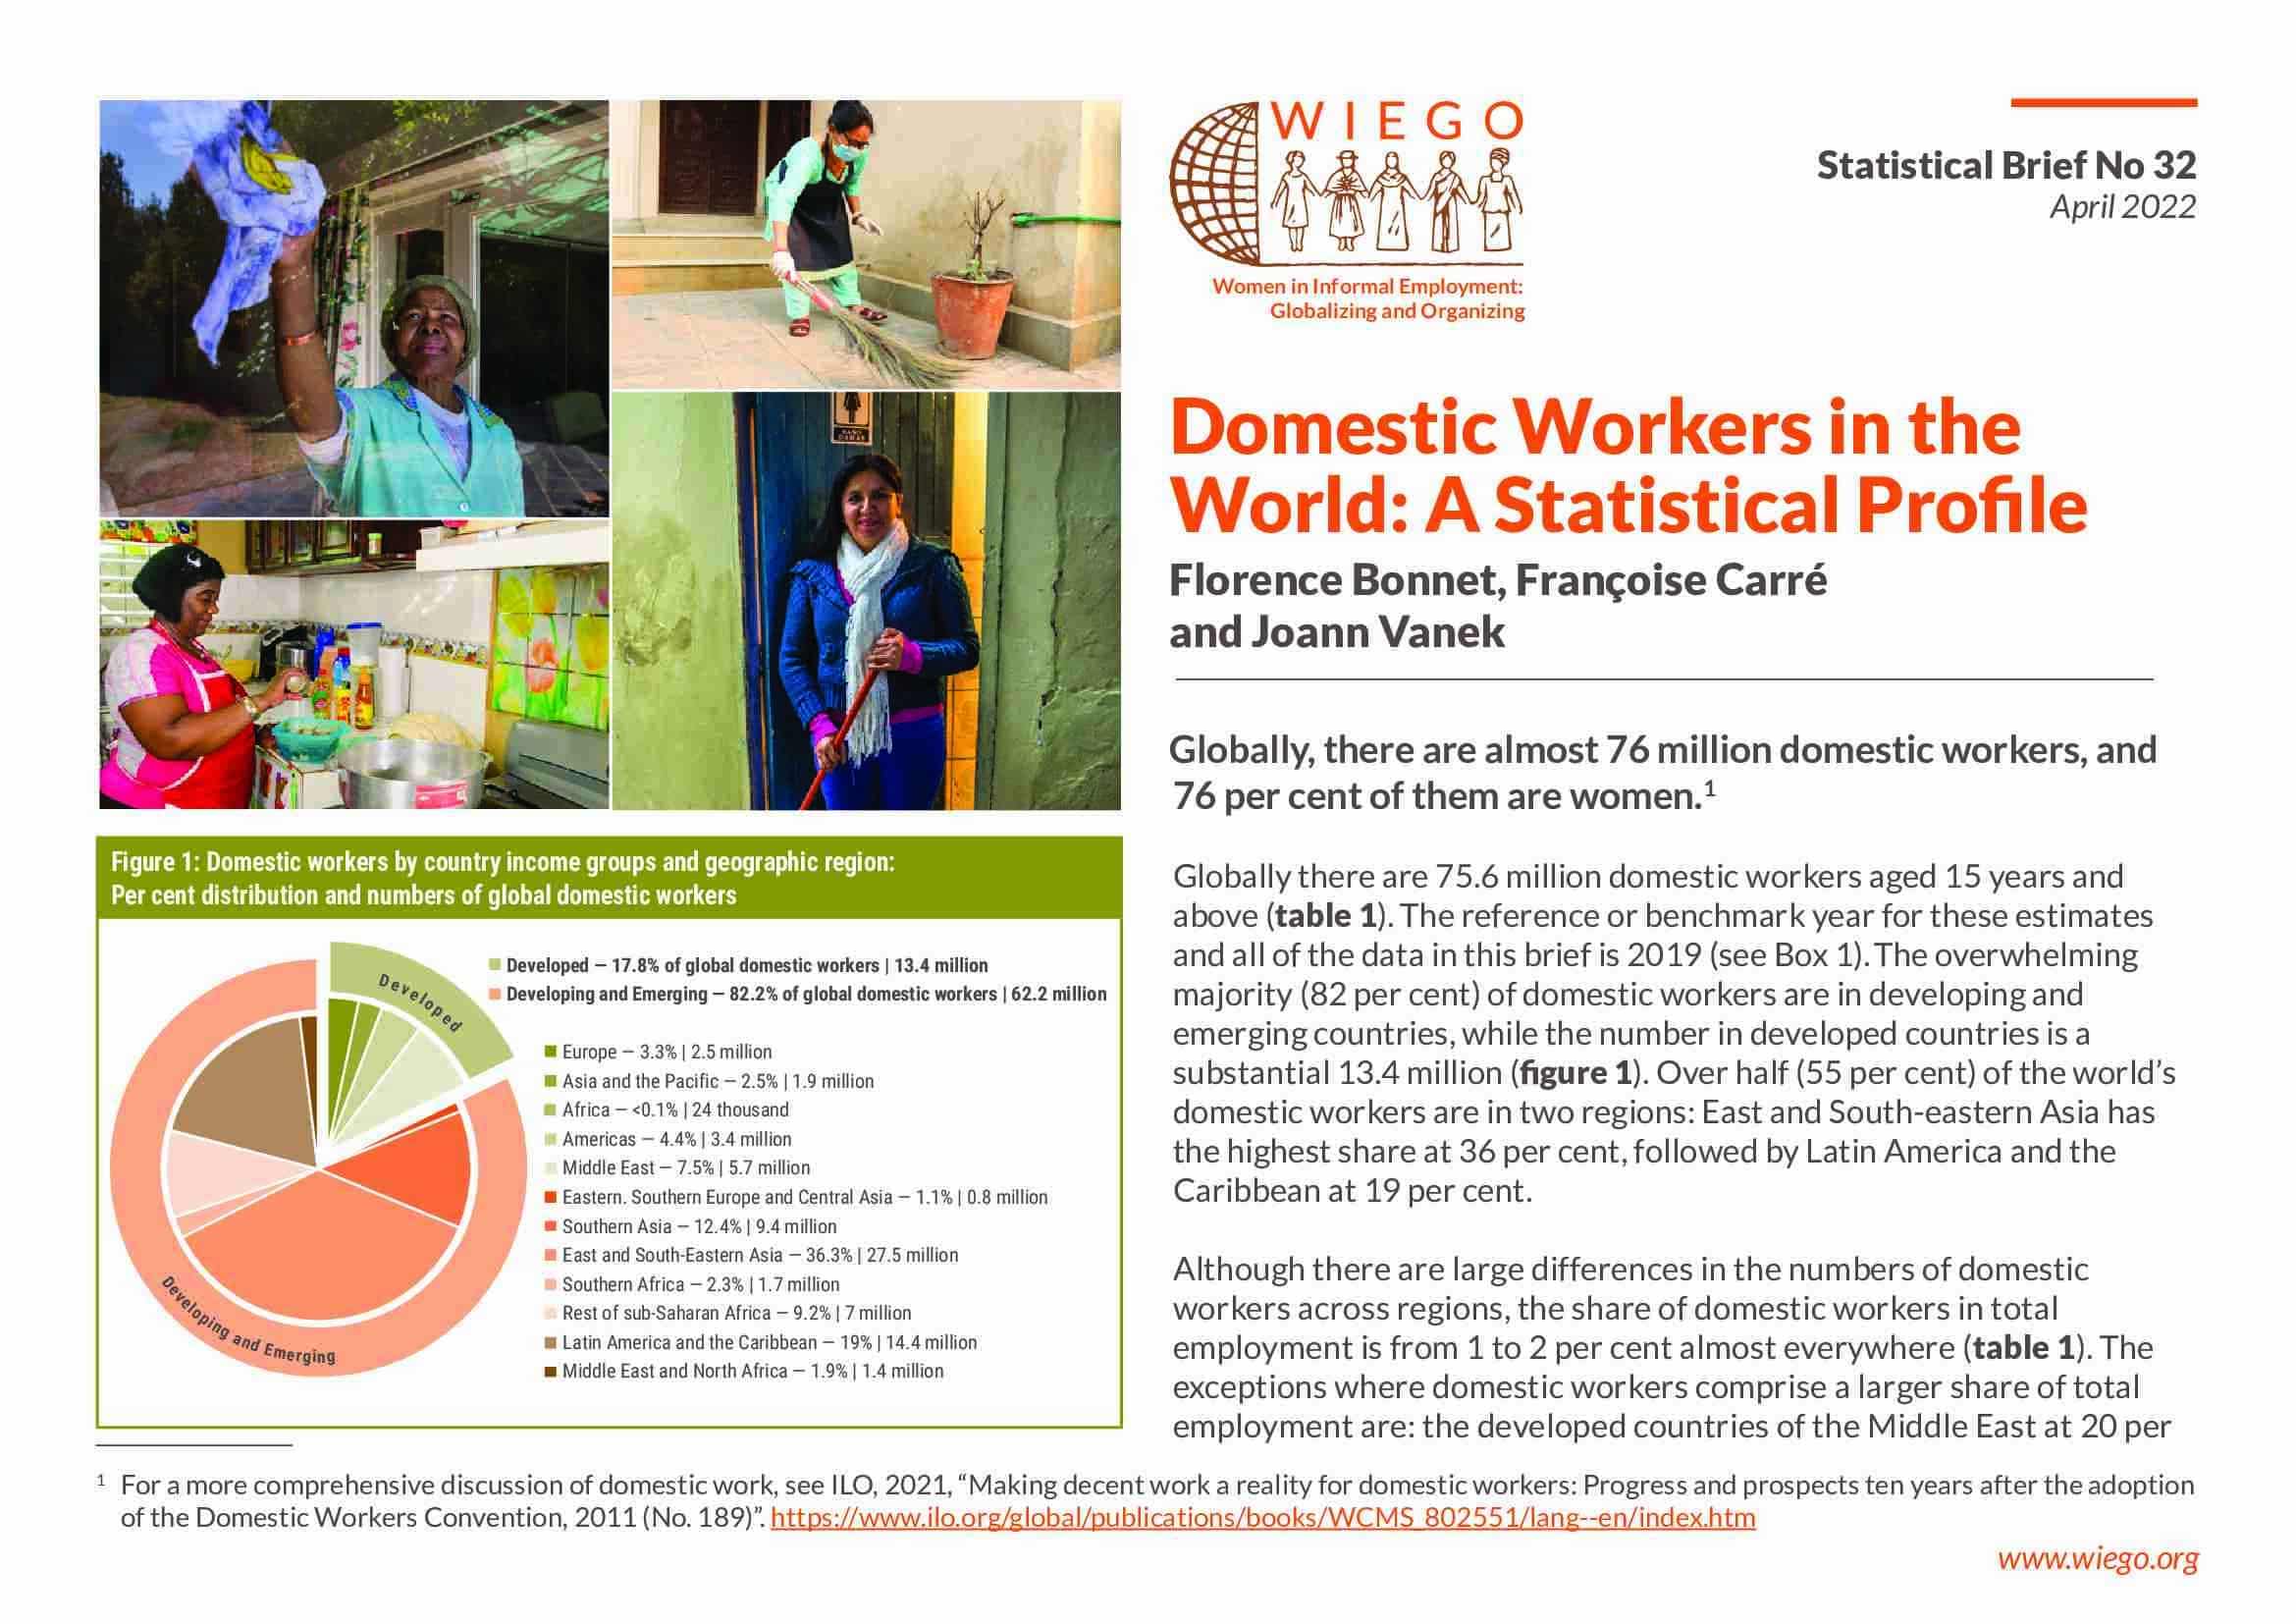
Since 2019, WIEGO has prepared a series of Statistical Briefs on the informal economy and groups of workers most exposed to informality (domestic workers, home-based workers, market traders, street vendors and waste pickers) in countries where WIEGO has or is developing active programs with organizations of these workers. The briefs present data at the national, urban and major city levels in formats accessible to a wide set of users for countries in Africa, Asia, Europe and Latin America.
Statistical Briefs Series
Additional Data for India
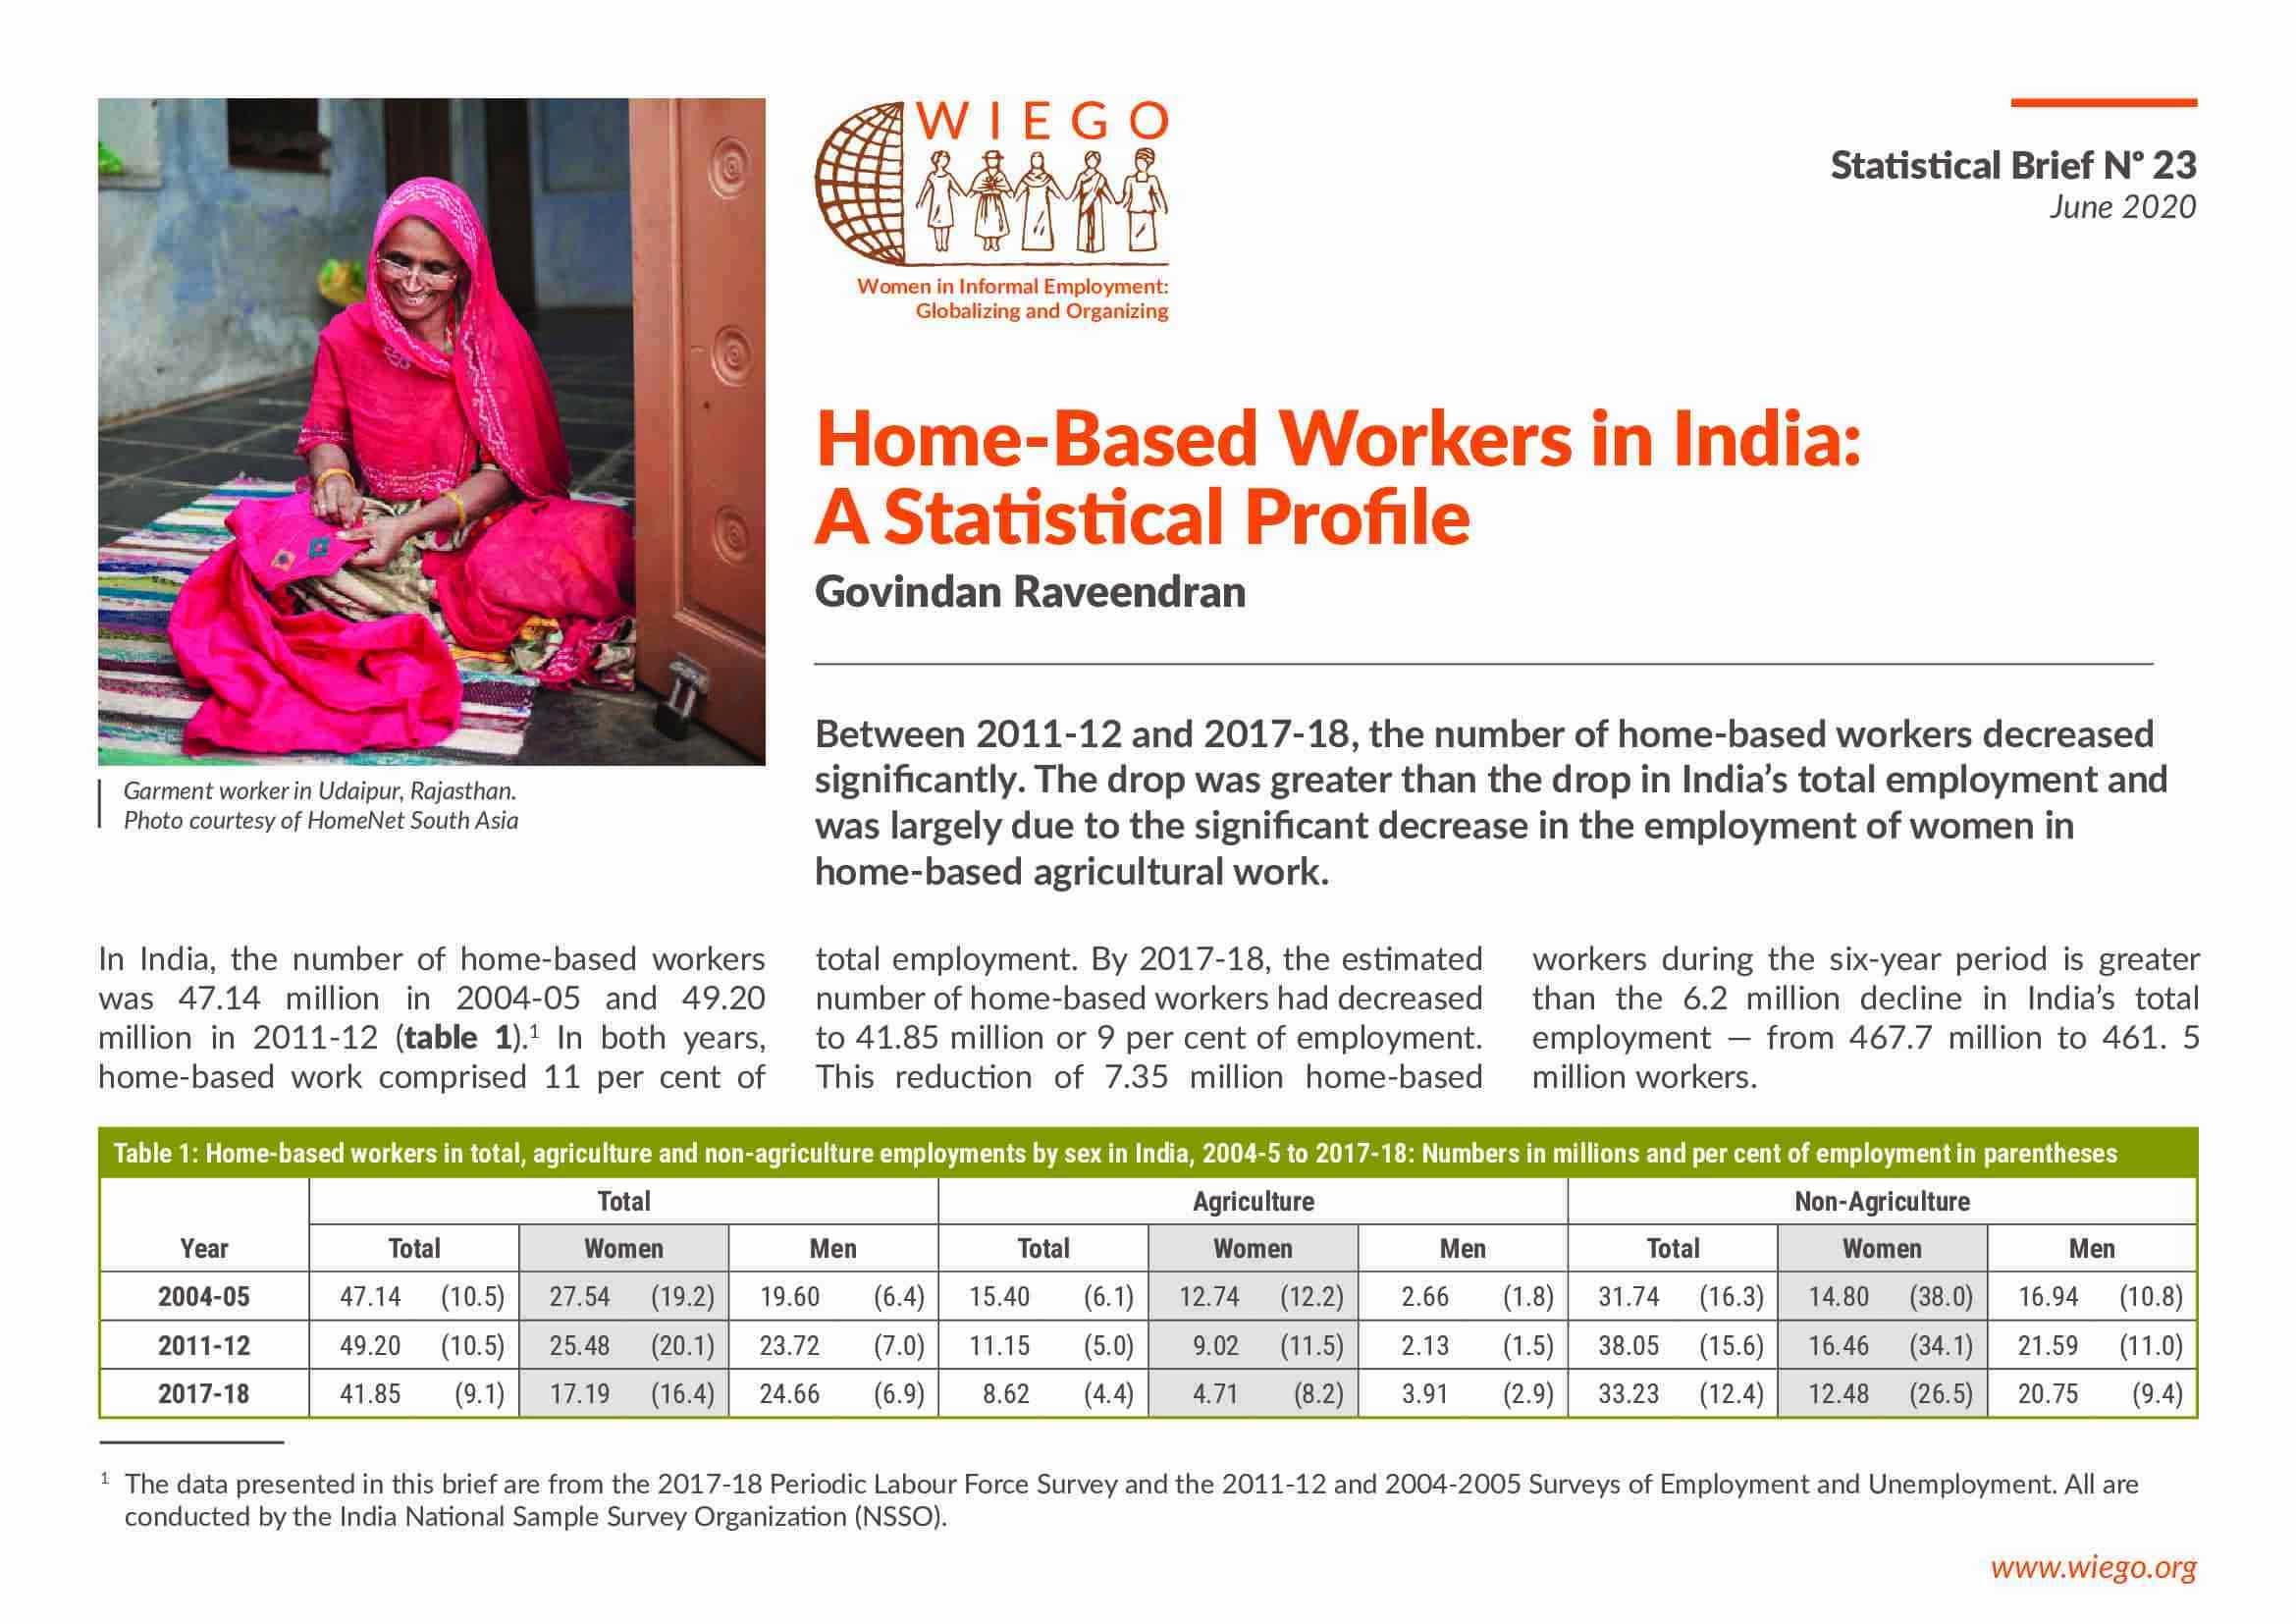
The results of the 2017-18 Periodic Labour Force Survey (PLFS) of India showed a sharp drop from 2011-12 in the rates of women’s employment. This survey, however, introduced changes in design and operations from earlier surveys. To understand the impact of these changes on rates of women’s employment, WIEGO commissioned Dr. Govindan Raveendran to prepare a history of the methods and operations of labour force surveys in India, with a focus on those methods that could affect the measurement of women’s employment. (See Measurement of Labour and Employment in India- Conceptual and Procedural Framework). In addition, Dr. Raveendran updated the statistical tables for 2017-18 with the 2018-19 PLFS data.
By Sector/Worker Groups
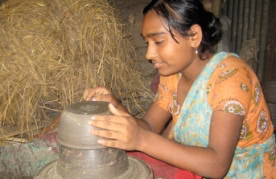
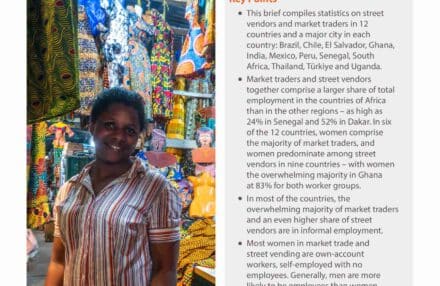
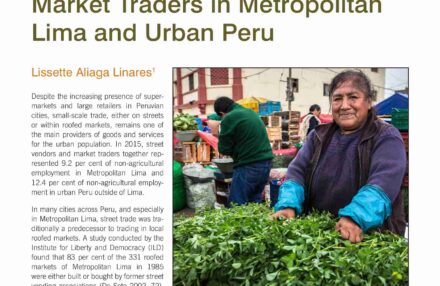
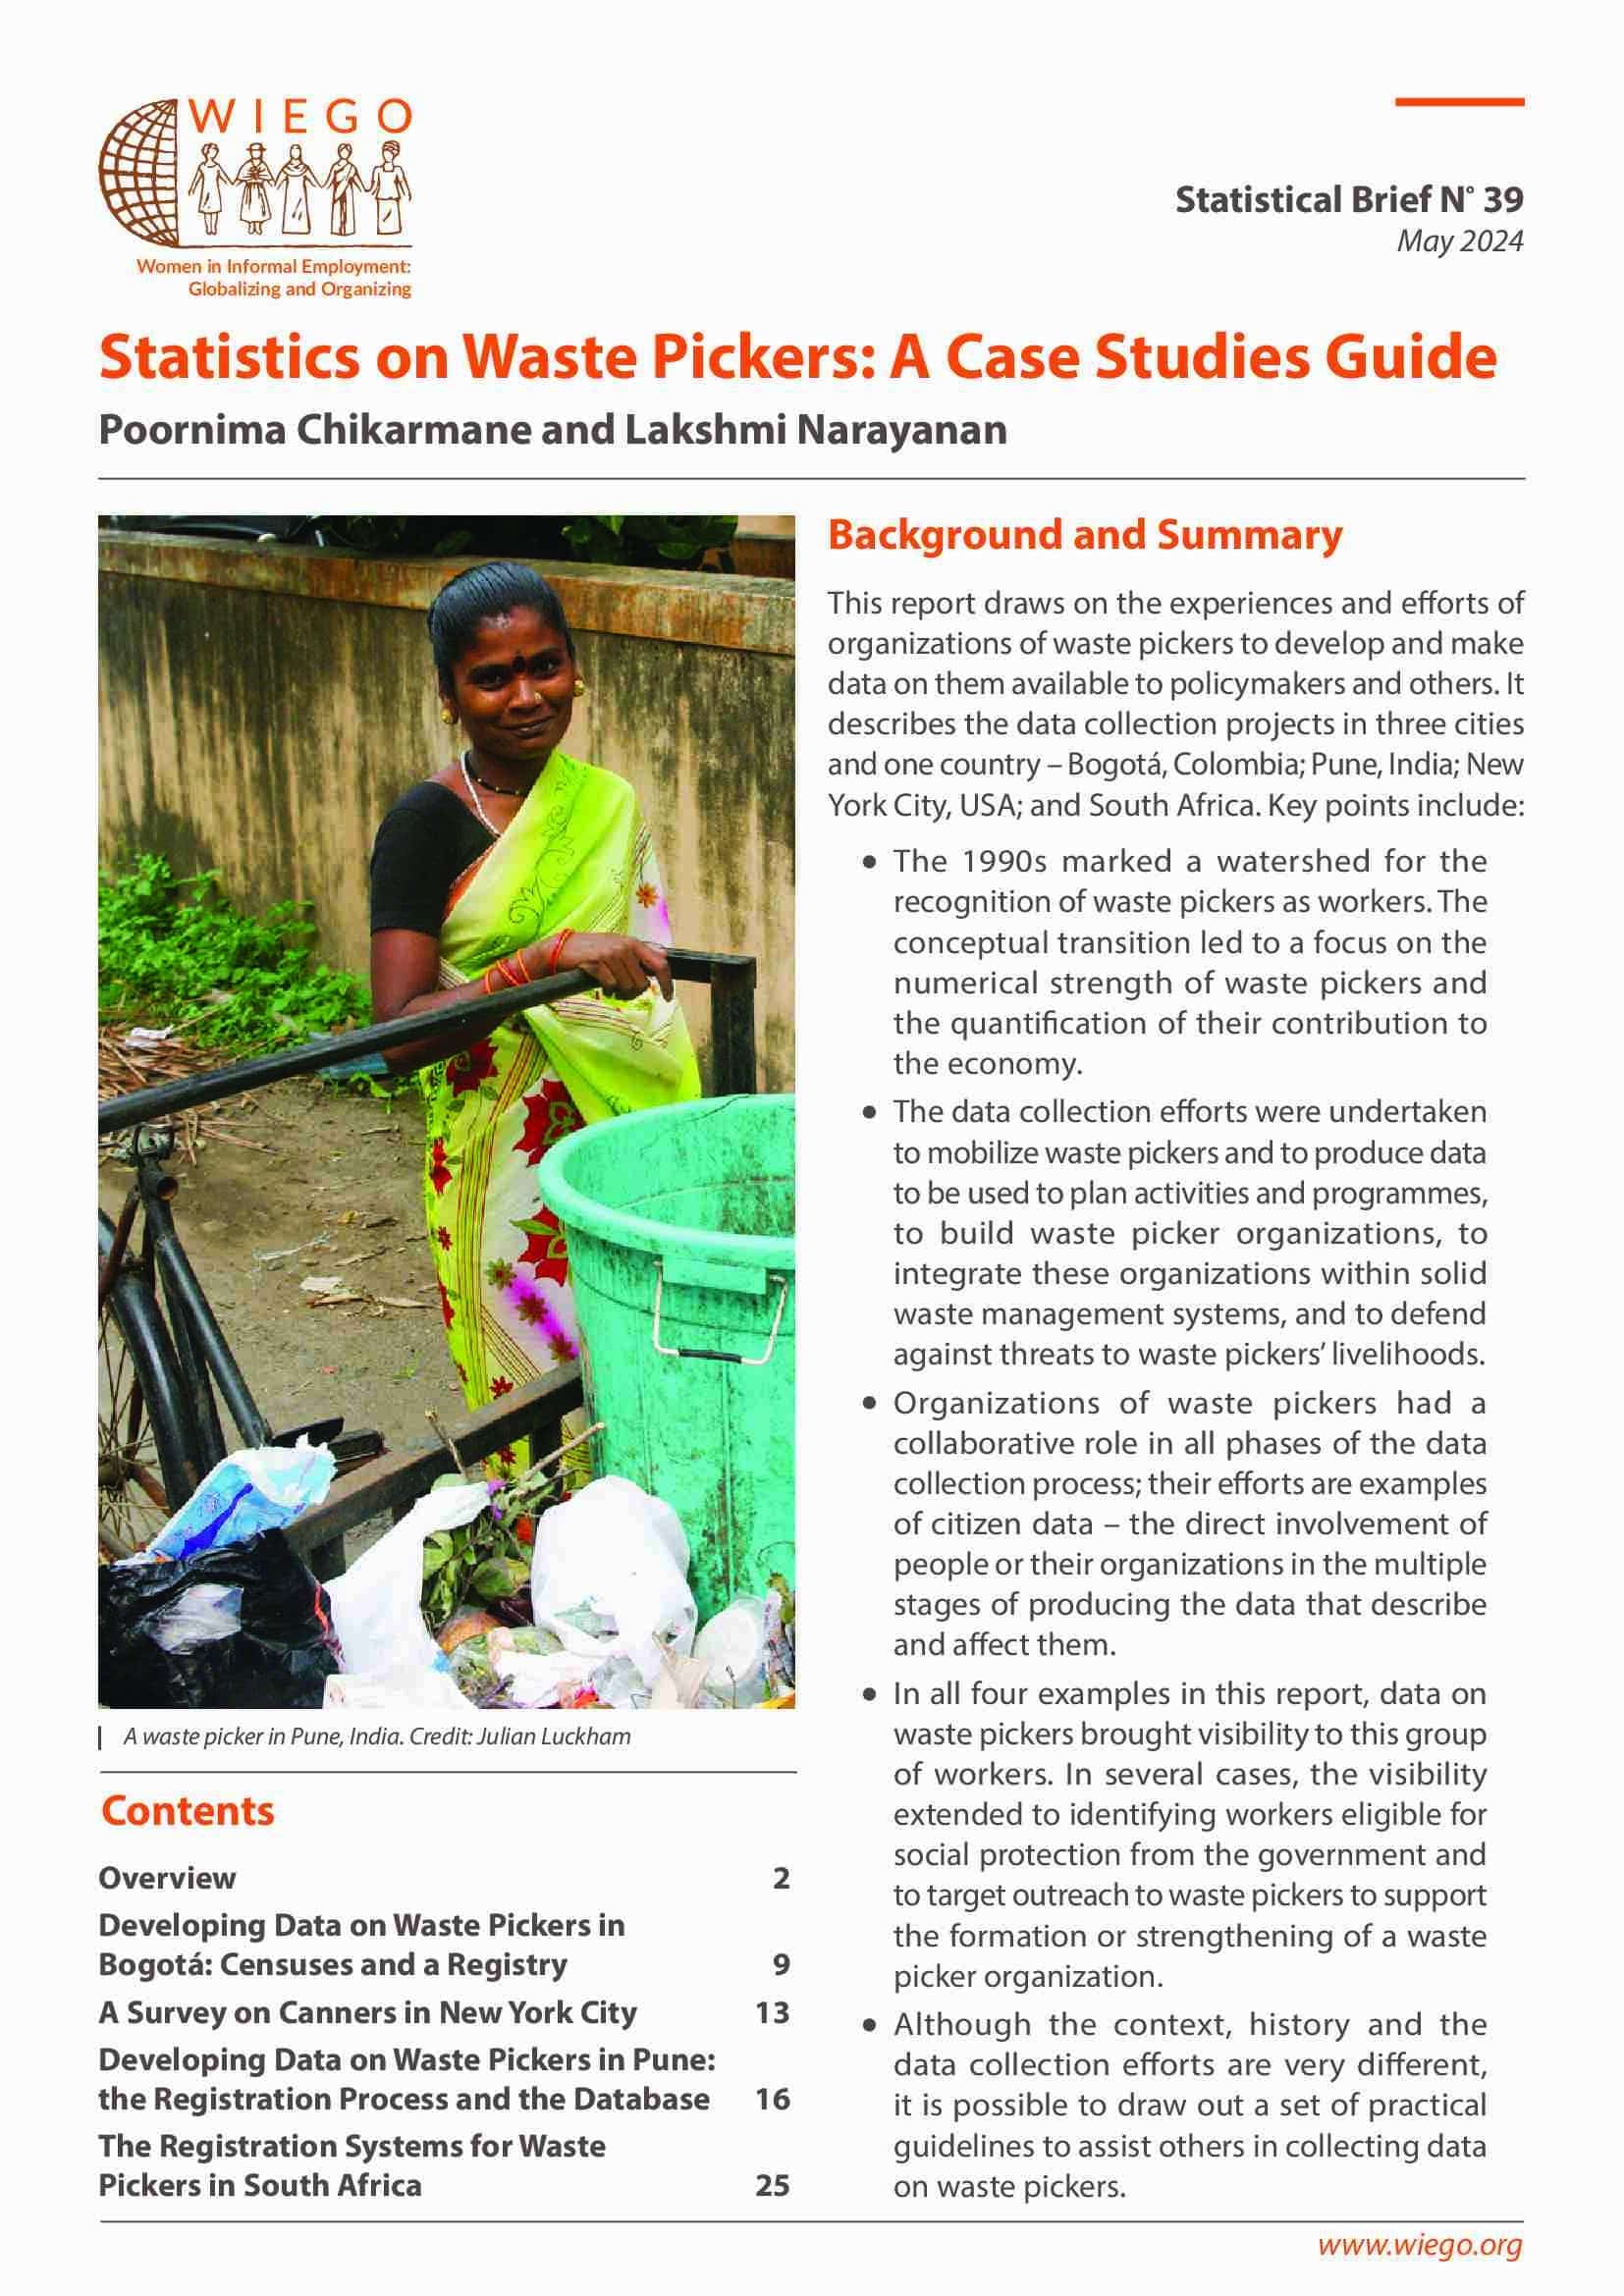
WIEGO works with organizations of worker groups that are important sources of employment for women and are largely informal, including domestic workers, home-based workers, market traders, street vendors, and waste pickers. These groups need and request data in their efforts to seek identification as workers — an essential first step in making unrecognized workers visible. The development and availability of statistics on these groups has advanced significantly with improvements in statistical methods, the availability of new survey data and the publication of WIEGO’s statistical briefs on each of the groups. In addition to the country briefs which include statistics on these worker groups, the following briefs are dedicated to statistics or the development of statistics on each of the worker groups:
Get in Touch with the Statistics Team
For questions on statistics on informal employment or on WIEGO’s work in statistics, please email the Statistics Programme
Contact Us(this link opens in new window)
Our Statistics Programme
The Statistics Programme works with statisticians to improve statistical methods that will make visible the size and significance of the informal economy and the situation of those working in it, and shares the data in accessible formats.
Learn More